How to use / FAQ
Find some guide lines on how to use/read/understand our user interface. Once you checked out our videos (click the cat) and these instructions, you can do your own research easily.
Search the FAQ:
Ask the cat

If anything is unclear, just click the cat. We've got tons of videos.
Base graph
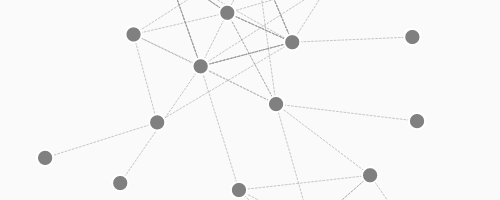
When you look at our application at the start, you see a basic graph. Although it looks so inconspicuous, it represents the power with which you can search all databases. Only the main nodes and edges are shown. By hovering and clicking the graph, you can find out, what kind of data we can offer you.
Ask a question
Simply fill in your question in natural language. Our natural language API looks for matching concepts and shows them for you.
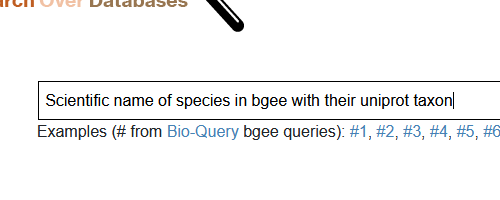
Example questions
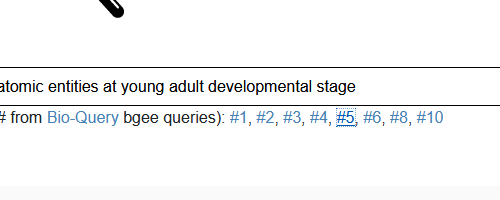
During our research on the databases, we've formulated some queries that show the variety of the given data and also of the possible questions. You can fill them into the query field by just clicking their numbers.
Search

By hitting search, all of the results are reseted. The query is sent to the API and we have to wait until the data comes back.
Searching the API

While we wait for the results, the search button indicates a spinning circle. We cannot do anything in the meantime.
Colored result
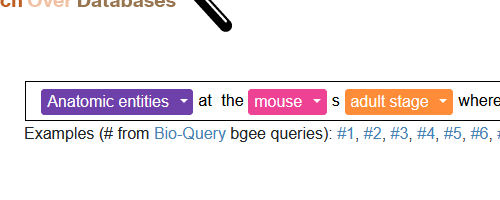
As soon as we get the result back from the API, the query bar changes. Instead of having text only, the found concepts transform to colored buttons. These colors will represent the items from now on.
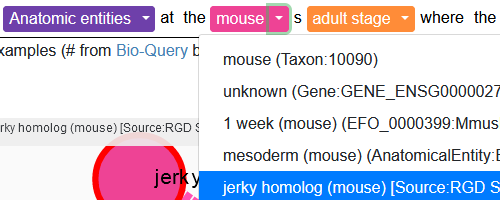
Dropdowns for concepts
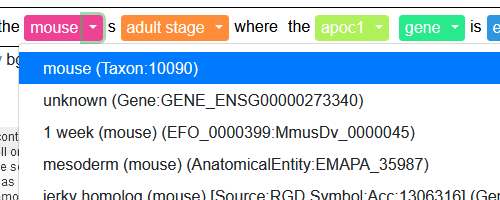
The concept buttons act as dropdowns. If more than one concept is found for one item, you can choose the one which best fits to your question.
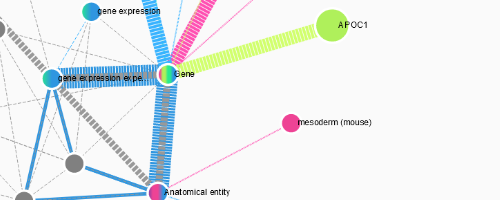
Hover an item
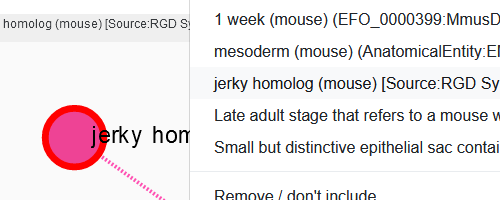
To better understand the different concepts, the according nodes get highlighted with a red border when you hover an item. It does not matter where you hover it (query bar drop down, graph, results table). If you hover the query bar button, all the according nodes are highlighted.
Color concept
To be able to follow an item from question to results table, the colors are kept the same for each item. The color itself has no meening at all bt is selectd to be as different from the others as possible.
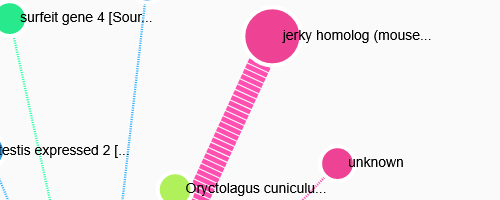
Node colors
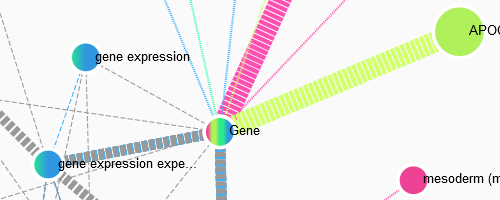
The nodes in the graph are colored according to the color concept as well. If a node belongs to more than one concept, it is indicated by having more than one color. Grey nodes determine from the original base graph.
Attach nodes

If a found concept is an instance of a Class in the graph, it gets attached to that. The information for this link will start with "attach link for ..."
Userchosen nodes
To get a result you have to chose one of the possible items from the API result. After loading the data, the first items get chosen automatically. You can chose another item by clicking it in the drop down or by double clicking it in the graph. All userschosen nodes are automatically selected for the results table.
Information on hover
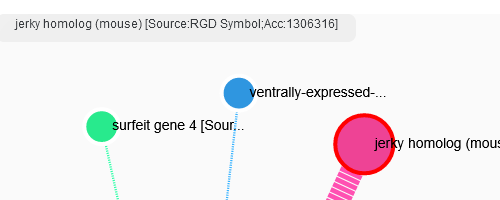
Hovering an item reveals it's full title in the top left corner of the graph. Gray nodes and edges which normally don't show any info on the graph additionally get labelled on site.
Information on click
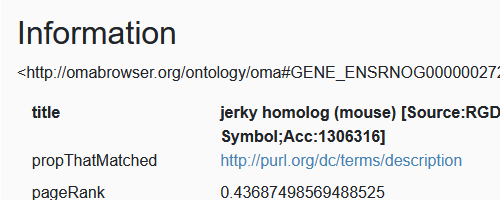
If you click an item, all the information about it will be shown in the "Dtails" tab. Where possible, the URI are linked.
Stroke colors & dashes
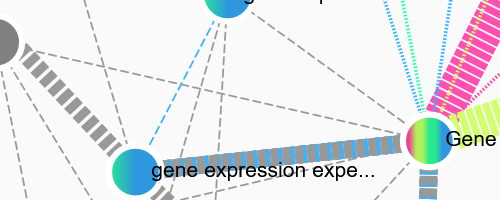
To get a better knowledge over the data, the graph follows the following rules for stroke styles:
- Stroke dashes:
- 3 1 userchosen & shortest link
- 4 1 attachlink & shortest link
- 1 0 userchosen link
- 1 1 attach link
- 5 2 other
- Stroke width:
- 30 userchosen & shortest link
- 20 attachlink & shortest link
- 10 shortest link
- 5 userchosen link
- 2 attach link
- 1 other
Results table
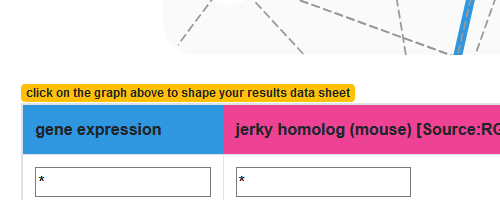
The results table represents the concpt you chose for your expected results. You can chose any node from the result by clicking "add to table" in the "Details" tab. The chosen concepts are added per default but can also be removed from the table.
Add to / remove from results table
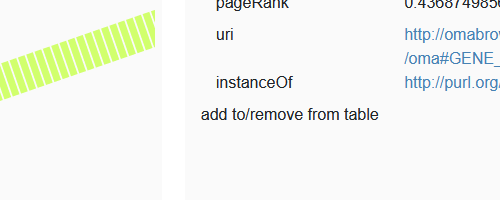
After clicking a concept, you can manually add or remove it to the results table by clicking "add to table" / "remove from table" in the "Details" tab.
Shortest path
Our Interface automatically calculates a shortest path between all of the chosen nodes. This path is indicated with a special dash and with.
Main topic / Filter / List
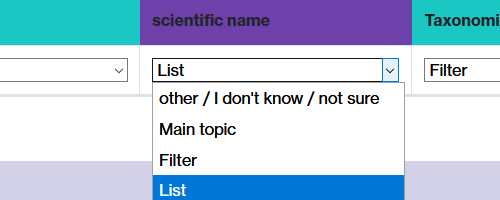
Choose wether your column is the main topic you are looking for, a filtering variable or the values you want to receive as a list.
If you ask #1 "Scientific name of species in bgee with their uniprot taxon", Species would be the main topic, the uniprot taxon and the scientific names the list values.